Statistical Tests: ANOVA vs. T-Tests vs. Z-Tests
First Published on 15 June 2023.
Background:
In the realm of statistics, understanding the differences and applications of various statistical tests is crucial for making accurate inferences from data. Among the most commonly used tests are ANOVA, T-tests, and Z-tests. In this blog post, we will demystify these statistical tests, explore their purposes, and shed light on when to use each one.
Statistical Tests: An Overview
ANOVA: Analysis of Variance
ANOVA, short for Analysis of Variance, is a statistical test designed to compare means across multiple groups or treatments. Its main objective is to determine if there are significant differences between the group means, based on the variation observed within and between the groups. ANOVA evaluates the null hypothesis that all group means are equal. If the null hypothesis is rejected, it signifies that at least one group mean differs significantly from the others.
The strength of ANOVA lies in its capability to simultaneously analyze multiple group comparisons. This approach minimizes the potential errors that could arise when conducting individual T-tests. ANOVA accomplishes this by dividing the total observed variance in the data into two components: the variation between groups and the variation within groups. By comparing these variances, ANOVA determines whether the observed differences are statistically significant.
T-Tests:
T-tests, named after William Sealy Gosset (who wrote under the pseudonym “Student”), are statistical tests used to compare means between two groups. They assess whether there is a significant difference between the means of two independent samples or the mean of a sample and a population.
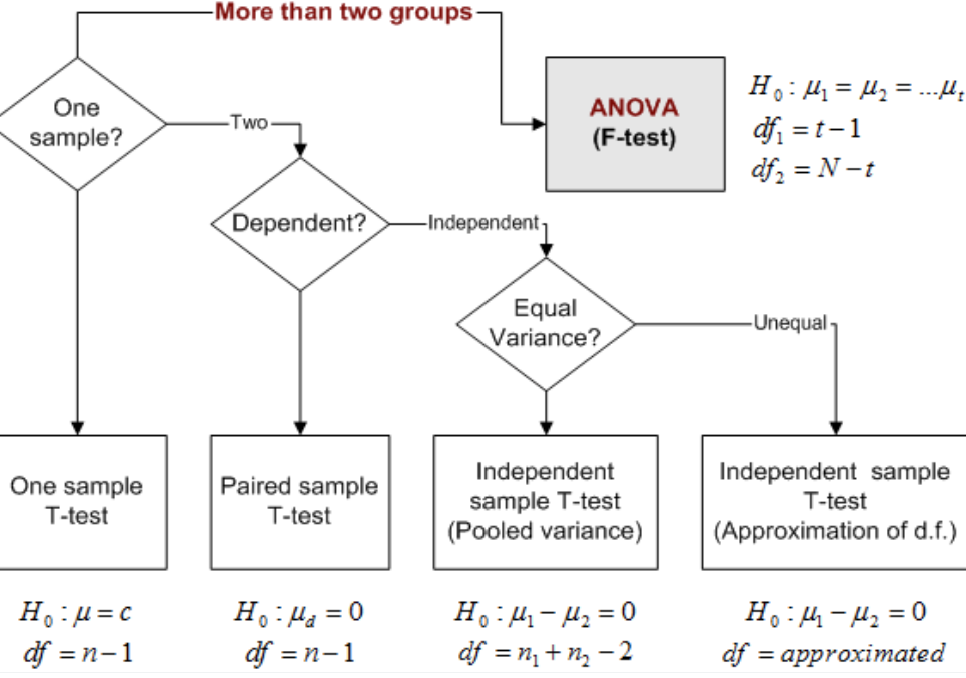
There are three common types of T-tests: independent samples, paired samples, and one-sample T-tests.
The independent samples T-test compares groups to determine if the groups’ means significantly differ. It’s a powerful test to assess the impact of different treatments or experimental conditions, leaving no room for ambiguity.
Meanwhile, the paired samples T-test focuses on related groups, such as pre-treatment and post-treatment measurements. It examines whether the mean difference between these related measurements is statistically significant, uncovering the true effect of the intervention.
Lastly, the one-sample T-test compares a sample mean to a known population mean. It determines if the sample represents statistical significance and not chance, revealing if its mean significantly deviates from the expected.
T-tests rely on the assumption that the data follows a normal distribution and that the variances of the groups being compared are approximately equal. However, when these assumptions are violated or the sample sizes are small, alternative non-parametric tests may be more accurate to use.
Z-Tests:
Z-tests are statistical tests used to determine whether a sample mean significantly differs from a known population mean when the population standard deviation is known. The Z-test is based on the standardized normal distribution (also known as the Z-distribution) and calculates the Z-score, which represents the number of standard deviations a sample mean is away from the population mean.
Z-tests are commonly used when the sample size is large, typically over 30, as they rely on the Central Limit Theorem, which states that the sampling distribution of the sample mean approaches a normal distribution regardless of the shape of the population distribution.
Z-tests are particularly useful when comparing a sample to a population or assessing the effectiveness of a new treatment against a known standard. However, if the population standard deviation is unknown or the sample size is small, the T-test is preferred. If the calculated Z-score exceeds the critical value (at 5% for example), the result would be deemed statistically significant at the 0.05 level.
Takeaways:
Statistical tests such as ANOVA, T-tests, and Z-tests are powerful tools that enable researchers and analysts to make evidence-based decisions and draw meaningful conclusions from data. ANOVA allows for the comparison of means across multiple groups, T-tests provide insights into differences between two groups, and Z-tests assess the significance of a sample mean compared to a known population mean. However, it is also important to understand when and where to apply these tests to ensure experimental accuracy.
editor's pick

news via inbox
Nulla turp dis cursus. Integer liberos euismod pretium faucibua